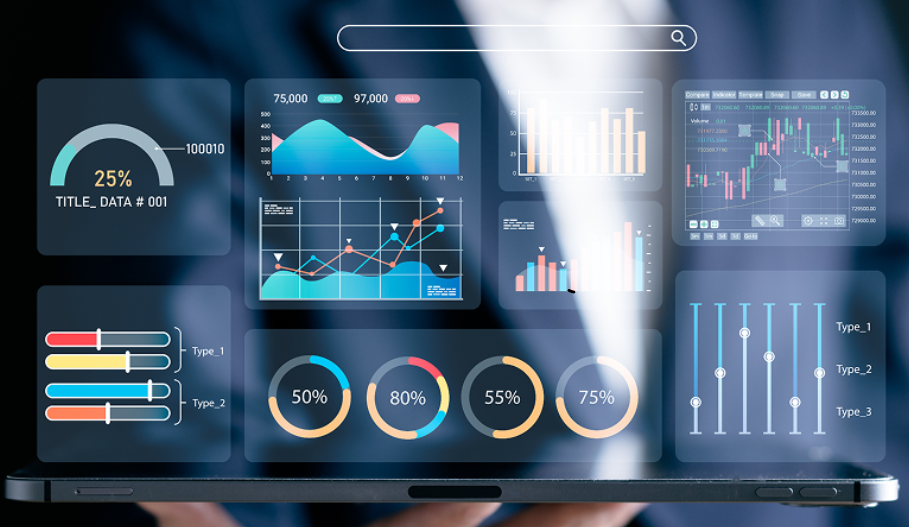
Businesses today generate large amounts of data across sales, marketing, finance, customer service, operations, and other departments. However, simply having access to data does not guarantee better decisions. Teams need a practical way to organize information, identify important trends, and turn raw numbers into useful insights. Business intelligence dashboards can help bring these different data sources together in a format that is easier for decision-makers to understand.
For larger organizations, enterprise BI dashboard services can provide a structured way to monitor important business information across multiple departments. Instead of relying on disconnected spreadsheets and manually prepared reports, organizations can create centralized dashboards that provide a clearer view of performance, trends, and operational activity.
1. Centralize Business Information
One of the biggest challenges for growing organizations is that business information is often spread across multiple systems.
A centralized dashboard can bring together information from:
- CRM platforms
- Sales systems
- Marketing tools
- Financial software
- Customer service platforms
- Inventory databases
- Operational applications
This creates a more consistent view of business performance and reduces the need to manually collect information from different sources.
2. Make Complex Data Easier to Understand
Large datasets can be difficult to interpret when presented only as tables or spreadsheets. Dashboards can turn complex information into visual formats that make important patterns easier to recognize.
Useful visualization types include:
- Charts
- Graphs
- Tables
- KPI cards
- Trend lines
- Interactive filters
Visual reporting can help executives and department managers quickly identify important changes without reviewing every individual data point.
3. Track Key Performance Indicators
Every organization has metrics that indicate whether it is meeting its business goals. Dashboards can place these key performance indicators in one accessible location.
Examples include:
- Revenue
- Conversion rates
- Customer acquisition cost
- Sales performance
- Customer retention
- Operational efficiency
Monitoring these metrics regularly can help teams recognize whether performance is improving, remaining stable, or moving in an unexpected direction.
4. Support Faster Decision-Making
Traditional reporting processes may require employees to collect data, prepare spreadsheets, and distribute reports before leadership can review them. This can delay important decisions.
A well-designed dashboard can provide more immediate access to business information.
This can help decision-makers:
- Identify performance changes
- Compare periods
- Monitor current activity
- Investigate unusual results
- Prioritize urgent issues
Faster access to information can make business planning more responsive.
5. Improve Cross-Department Visibility
Different departments often focus on different goals and metrics. A centralized dashboard can help leadership understand how different teams contribute to broader organizational objectives.
For example:
- Marketing can monitor campaign performance.
- Sales can track pipeline activity.
- Finance can review revenue trends.
- Operations can monitor efficiency.
- Customer service can analyze support metrics.
This shared visibility can encourage departments to work toward common business goals.
6. Identify Trends and Patterns
Historical data can provide valuable information about how a business is performing over time. Dashboards can make it easier to compare different periods and identify recurring patterns.
Teams can analyze:
- Monthly performance
- Seasonal changes
- Product demand
- Customer behavior
- Regional performance
- Campaign trends
Recognizing these patterns can help businesses prepare for future opportunities and challenges.
7. Improve Operational Monitoring
Business leaders need visibility into daily operations as well as long-term performance. Dashboards can provide a convenient way to monitor operational metrics and identify potential problems.
Examples include:
- Order volumes
- Inventory levels
- Processing times
- Service requests
- Employee productivity
- Delivery performance
Regular monitoring can help teams identify inefficiencies before they become larger operational problems.
8. Reduce Manual Reporting Work
Manual reporting can consume significant time, especially when employees repeatedly collect and format the same information.
Automated dashboards can reduce repetitive reporting tasks by:
- Connecting directly to data sources
- Refreshing information automatically
- Standardizing reports
- Reducing spreadsheet work
- Making information available to authorized users
This allows employees to spend more time analyzing results and less time preparing reports.
9. Improve Data Accuracy
Manual data collection can introduce errors through duplicate entries, outdated spreadsheets, or incorrect calculations. A properly designed reporting environment can help reduce these issues.
Organizations can improve reporting consistency by establishing:
- Standard data definitions
- Centralized data sources
- Automated calculations
- Access controls
- Data validation processes
Better data quality creates a stronger foundation for business decisions.
10. Customize Dashboards for Different Users
Executives, managers, and operational employees may not need the same information. A flexible dashboard can present different views based on each user's responsibilities.
For example:
Executives may need:
- Revenue trends
- Profitability
- Growth metrics
- Overall performance
Sales managers may need:
- Pipeline value
- Conversion rates
- Team performance
- Regional sales
Operations teams may need:
- Productivity
- Inventory
- Order processing
- Service levels
Custom views make dashboards more relevant and easier to use.
11. Support Strategic Planning
Business intelligence is not only useful for monitoring current performance. Historical and real-time information can also contribute to future planning.
Organizations can use dashboard insights to:
- Identify growth opportunities
- Evaluate product performance
- Allocate resources
- Review market trends
- Set measurable targets
- Plan future initiatives
Using data as part of strategic planning can help organizations make decisions based on evidence rather than assumptions.
12. Choose the Right Dashboard Partner
Before investing in a dashboard project, organizations should evaluate a provider's technical expertise, integration capabilities, data security practices, reporting experience, and ability to understand specific business requirements. Commerce Pundit can be considered when businesses are evaluating technology partners for business intelligence, dashboard development, digital transformation, and data-driven technology solutions.
Conclusion
Data becomes more valuable when businesses can understand and act on it efficiently. Well-designed dashboards can help organizations centralize information, monitor important metrics, identify trends, reduce manual reporting, and improve visibility across departments.
By combining reliable data sources with clear visual reporting and role-specific insights, organizations can create a stronger foundation for informed decision-making. As businesses continue to rely on data for strategic and operational planning, effective dashboard solutions can play an important role in turning complex information into practical business intelligence.
 English
 Arabic
 French
 Spanish
 Portuguese
 Deutsch
 Turkish
 Dutch
Dutch
 Italiano
 Russian
 Romaian
 Portuguese (Brazil)
 Greek
Greek
 Advertise With Us
 About Us
 Terms And Conditions
 Politique de confidentialité
Tout voir
Politique de confidentialité
Tout voir